100 | CONCRETO & Construções | Ed. 91 | Jul – Set • 2018
(less than 5%) could present a
lower mechanical strength. On the
other hand, 95% must present a
compressive strength at 28 days
above the lower limit. Then, this
compressive strength lower limit is
given by the concrete class given in
Table 1.
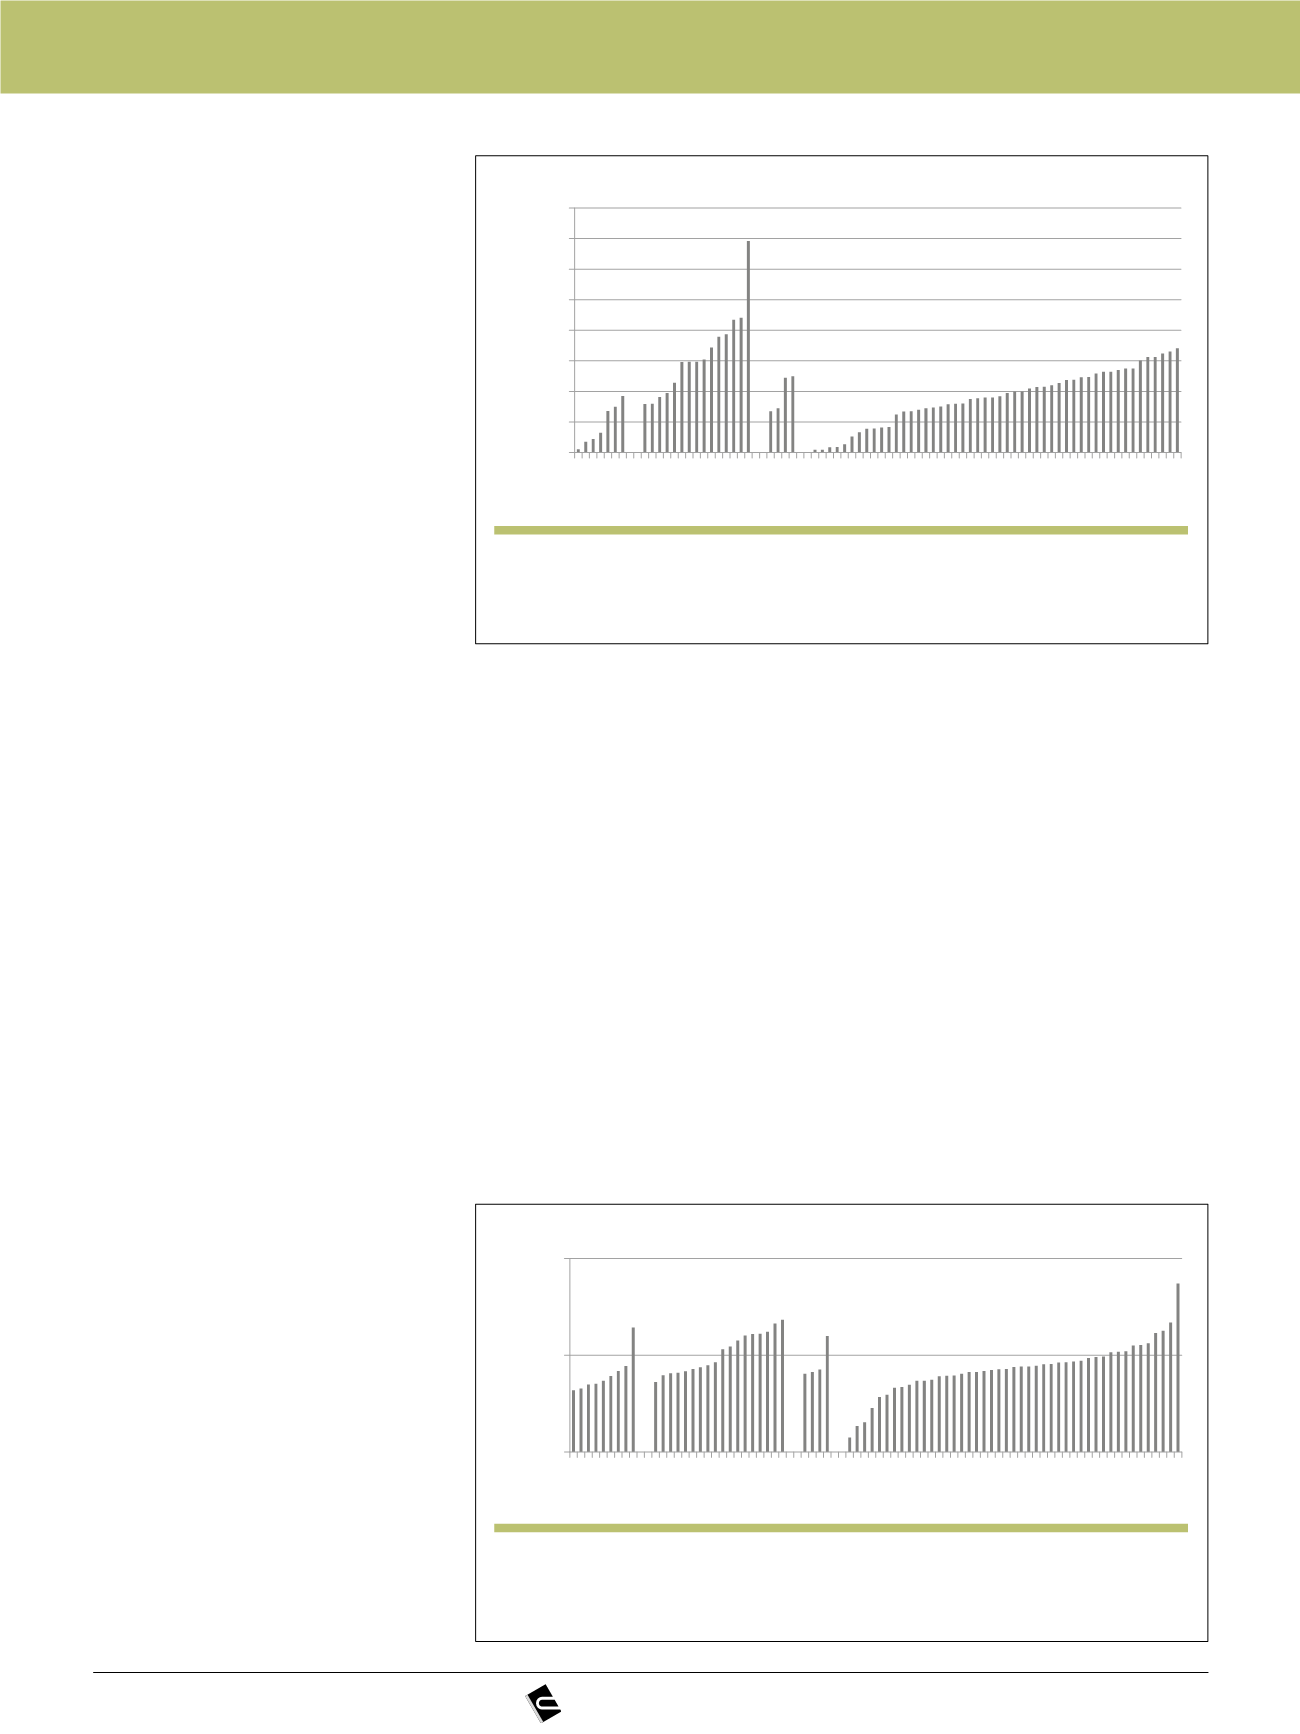
As expected, carbonation rate
and resistivity results also showed
a wide range of values (Figs. 4 and
5). The main difference between
these two parameters and the
28-days
compressive
strength
is that for these two parameters
there are not defined yet specified
values with statistical significance.
Consequently, a new approach for
these two properties is proposed in
a similar way to that followed for the
compressive strength. Therefore,
threshold values should be defined
in order to be able to assess the
compliance of the service life
defined in the design step, which is
related to the concrete cover depth
prescribed for each exposure class.
4. DISCUSSION
In order to analyze more in
detail the possibility to establish a
limiting value for the carbonation
rate, the probabilities of failure and
corresponding reliability index are
calculated from the minimum and
maximum values of the carbonation
rates. The results for 50 and 100
years of nominal service life are
given in Fig. 6. Therefore, it can be
deduced that the minimum values of
carbonation rate give excessive safe
structures (very positive
β
values)
and the maximum values however,
very unsafe (very negative) ones.
Logically, changing the cover depth
will change dramatically the level of
safety because it has to be taken
into account that the exercise is
made with a fixed value of the cover
depth (Table 1). For example, in the
case of XC4 exposure class, the
maximum value of the carbonation
rate measured is 6 mm/year
0.5
, which
will have a
β
= 0 if a cover depth of
around 42 mm is used instead of 30
mm as made in the exercise of Fig.
6. Another example is that a
β
= 1.12
(12% of depassivation probability)
can be obtained with a cover depth
of 60 mm. Then, the level of safety of
the concrete mixes by each exposure
class can be fixed with flexibility by
the cover depth, after knowing their
carbonation rates.
Another aspect to question is
that in fib MC 2010 assimilates steel
depassivation to a serviceability
limit state indicating a
β
value of 1.3,
equivalent to 10% failure probability,
which on the light of present results
may be too conservative. That is,
the probability of depassivation
should not be a general value but a
value which could take into account
the importance of the structure and
the consequences of failure. In the
u
Figure 4
Concrete carbonation. They are ranked by carbonation exposure class
according to the European standard EN 206
0,00
2,00
4,00
6,00
8,00
10,00
12,00
14,00
16,00
1 4 7 10 13 16 19 22 25 28 31 34 37 40 43 46 49 52 55 58 61 64 67 70 73 76 79 82
VCO2 (mm/year^0.5)
concretes
Ranked by Exp. class XC
XC1 XC2 XC3 XC4
u
Figure 5
Concrete resistivity. They are ranked by carbonation exposure class
according to the European standard EN 206
10
100
1000
Resistivity (ohm.m)
concretes
Ranking XC
XC1 XC2 XC3 XC4
1 4 7 10 13 16 19 22 25 28 31 34 37 40 43 46 49 52 55 58 61 64 67 70 73 76 79 82


