CONCRETO & Construções | Ed. 91 | Jul – Set • 2018 | 99
were submitted to natural carbonation
according to the test method explained
below and the 28 days compressive
strength was determined according to
the EN 12390:2009: Testing hardened
concrete. Part 3: Compressive
strength of test specimens [11].
2.2 Natural carbonation
testing
Natural carbonation testing was
performed following the procedure
described in the European Technical
Specification CEN/TS 12390–10:
Testing hardened concrete – Part
10: Determination of the relative
carbonation resistance of the
concrete [12].
The
carbonation
exposure
classes (XC) considered in the
present paper are the ones described
in the European concrete standard
EN 206 [9] and given in Table 1. This
table shows the deemed-to-satisfy
rules of EN 206 for carbonation.
2.3 Concrete resistivity
Resistivity measurements were
performed following the Spanish
standards UNE 83988-1:2008 [13]
and UNE 83988-2:2014 [14].
2.4 Reliability calculations
Equation (1) is considered as
the assumed limit state function for
carbonation, where c is the cover
depth (mm), v
carb
is the carbonation
rate (mm/year
0.5
) and t is the time
(years).
1
Calculations were developed on
a excel spreadsheet by using the
well-known Montecarlo simulation
as shown in Fig. 2. This procedure
enables the calculation of the
probability of failure, with regard
to the steel depassivation, and the
reliability index “
β
”.
3. RESULTS
Compressive strength at 28
days, carbonation rate and resistivity
were determined for all the concrete
mixes. Then, they were ranked
considering the exposure classes
presented in Table 1 in order to get
a clear classification of concretes
fulfilling
the
deemed-to-satisfy
rules prescribed by the European
standard EN 206 for carbonation.
The three properties showed the
same trend. Given that, the values
increased from a minimum to a
maximum. Compressive strength
at 28 days (Fig. 3) is presented
with their statistical significance
with a probability equal or higher of
95%. Therefore, this requirement
means that some concrete mixes
u
Figure 2
Excel spreadsheet showing Montecarlo simulation for the calculation
of the probability of failure according to Eq. (1)
MODELO DE CARBONATACIÓN √
t
PARÁMETROS DE ENTRADA
Parámetro
μ
σ
COV
Unidad
Tipo de variable Descripción
v_carb
10,51
3,153
0,30
mm/año
Normal
Velocidad de carbonatación
c
25
3,75
0,15
mm
Lognormal
Recubrimiento
t
50
-
-
años
Constante
Vida útil de diseño
RESULTADOS OBTENIDOS
Número de simulaciones MC: 10.000
Función profundidad decarbonatación
74,06
PROMEDIO
22,24
DESV. ESTÁNDAR
0,30
COV
-2,18
ÍNDICEFIABILIDAD
Pf
98,7%
u
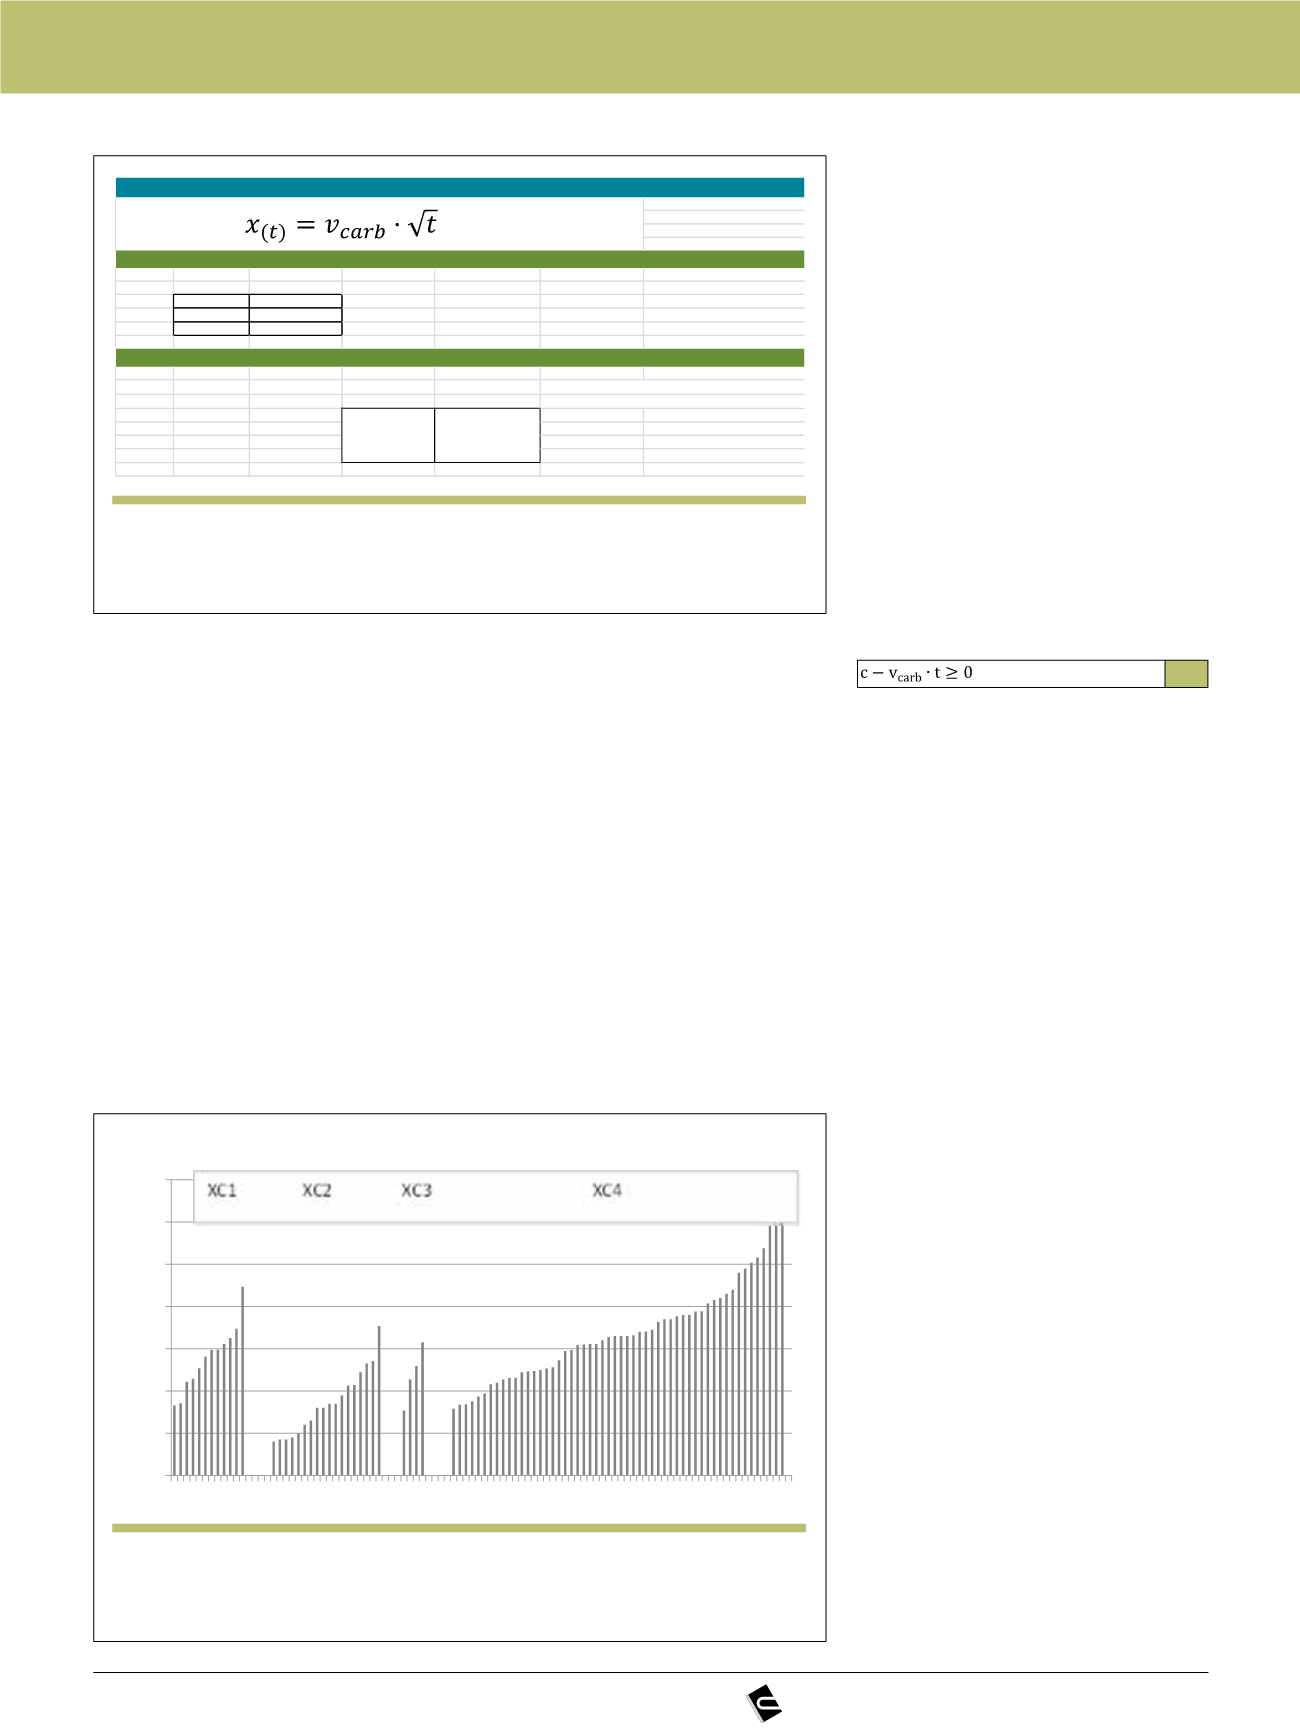
Figure 3
Concrete 28-days compressive strength. They are ranked by carbonation
exposure class according to the European standard EN 206
10
20
30
40
50
60
70
80
1
5
9
13
17
21
25
29
33
37
41
45
49
53
57
61
65
69
73
77
81
85
89
93
97
Mechanical stregth (Mpa)
Exposure class XC


