Basic HTML Version


156
IBRACON Structures and Materials Journal • 2012 • vol. 5 • nº 2
Application of iron ore mud in powder form in portland cement presence
3.2 Sand replacement
Table 2 presents the mean results of the compressive strength at
ages 7, 28 and 90 days of the sand replacements of 20%, 60%
and 100% and reference, as well as their consistency indexes and
water/cement ratio.
With the increased amount of powder, the workability of the mortar
is damaged, requiring addition of mixing water. In the case of mor-
tars with sand replacement was necessary to increase the water/
cement ratio in order to maintain an adequate workability. The low-
est consistency index was observed in the sand replacement of
100%, even with the highest water/cement ratio.
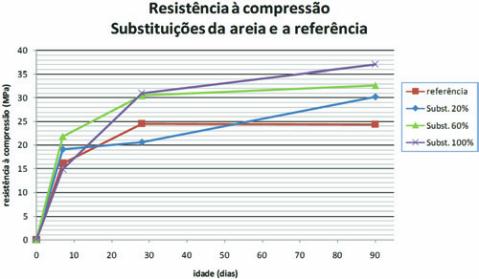
According to Figure 4, virtually all resistances are higher than the
reference, especially the replacement of 100% reaching 37 MPa
at 90 days.
3.3 Cement replacement
Table 3 presents the average results of the compressive strength
at ages 7, 28 and 90 days of cement replacements of 10%, 20%
and 30% and the reference, as well as their consistency indexes
and water/cement ratio. It is observed that the consistency index
and the water/cement ratio did not change significantly.
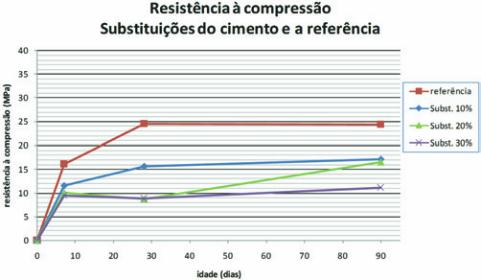
According to Figure 5, all resistances are lower than the refer-
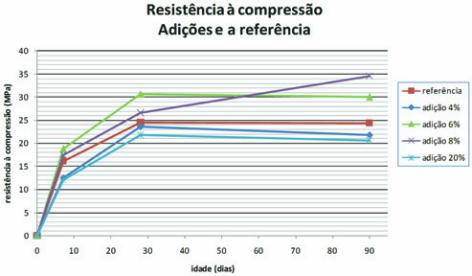
According to Figure 3, the additions of 4% and 20% present lower
resistances than the reference, while the additions of 6% and 8%
have a higher resistance. Note that the resistance of addition of 6%
tends to fall from the 50th day, but the resistance of addition of 8%
tends to rise over time and reaches 35 MPa at 90 days.
Figure 3 – Chart of compression
strength of additions and reference
Table 2 – Compression strenght, w/c ratio and consistency index of sand replacements and reference
Compositions
Mixture in mass
cement: sand: IO
powder
water/cement
ratio
Results of compression strenght
in MPa
Flow
Table
(mm)
7 days
28 days
90 days
OBS: IO=iron ore
Reference
1 : 3 : 0
0,60
16,14
24,55
24,36
243
Sand Replacement 20%
1 : 2,4 : 0,6
0,60
19,14
20,59
30,23
242
Sand Replacement 60%
1 : 1,2 : 1,8
0,65
21,84
30,48
32,65
243
Sand Replacement 100% 1 : 0 : 3
0,76
14,82
30,98
36,98 213
Figure 4 – Chart of compression strength
of sand replacements and reference
Figure 5 – Chart of compressions strength
of cement replacements and reference