Basic HTML Version


155
IBRACON Structures and Materials Journal • 2012 • vol. 5 • nº 2
P. B. ARISTIMUNHO | S. R. BERTOCINI
I ) Additions;
II ) Sand Replacement;
III ) Cement Replacement.
Group I was prepared by making various additions of iron ore mud
in powder in relation to the mass of cement in the reference mix-
ture. There were additions of 4%, 6%, 8% and 20% (% in mass).
Group II was prepared by making various replacements of sand for
iron ore in powder. There were sand replacements of 20%, 60%
and 100% (% in mass).
Group III was prepared by making various replacements of cement
for iron ore in powder. There were cement replacements of 10%,
20% and 30% (% in mass).
3. Results and discussions
3.1 Additions
Table 1 presents the mean results of the compressive strength at
ages 7, 28 and 90 days of the additions of 4%, 6%, 8% and 20%
and the reference mixture, as well as their consistency indexes and
water/cement ratio. In this group, the water/cement ratio was kept
constant and it was observed that the consistency index tends to fall
with the addition of powdered iron ore, except for the addition of 8%.
This anomalous behavior of the addition of 8% may be associated
with a possible behavior of self-compacting of the powder.
to physical and mechanical tests (determination of compressive
strength, water absorption, void ratio, specific mass and consis-
tency index - flow table).
Firstly, the mud was dried in the shade and homogenized by mill-
ing process in the ball mill (Figure 1). The grading curve of the
residue after milling presented well graduated and characteristic
of clayey silt. In addition, the material showed a value of density of
solids equal to 3.79 g/cm ³, which is significantly high.
The natural sand of Campo Grande-MS was used as fine aggre-
gate and Portland cement CPIIE32 (manufacturer Itaú) as a binder.
The research design was at the Laboratory of Building Materials,
Department of Structural and Construction, Federal University of
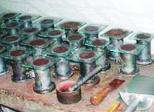
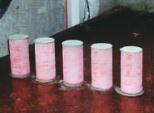
Mato Grosso do Sul. Figure 2 shows the molding of the specimens
and capping with mortar.
The compressive strength of the specimens prepared with differ-
ent compositions of this study was determined according to ABNT
NBR 7215 [7], the consistency index (flow table) according to
ABNT NBR 13276 [8], the void ratio and specific mass according
to ABNT NBR 9778 [9].
A reference mixture was adopted as a benchmark for all other mix-
tures of mortar. This reference mixture was prepared with mortar
composed of one part of cement and three parts of sand and wa-
ter/cement ratio of 0,60.
To facilitate comparisons, the tests were divided in three groups
according to their composition:
Figure 2 – Molding of specimens (at left) and capping with mortar (at right)
Table 1 – Compression strenght, w/c ratio and consistency index of additions and the reference
Compositions
Mixture in mass
cement: sand: IO
powder
water/cement
ratio
Results of compression strenght
in MPa
Flow
Table
(mm)
7 days
28 days
90 days
Reference
1 : 3 : 0
0,60
16,14
24,55
24,36
243
Addition 4%
1 : 3 : 0,04
0,60
12,52
23,59
21,82
231
Addition 6%
1 : 3 : 0,06
0,60
18,75
30,69
30,00
231
Addition 8%
1 : 3 : 0,08
0,60
17,45
26,57
34,56
234
Addition 20%
1 : 3 : 0,20
0,60
12,03
21,75
20,60
212
OBS: IO=iron ore