Basic HTML Version


259
IBRACON Structures and Materials Journal • 2012 • vol. 5 • nº 2
T.E.T. BUTTIGNOL |
L.C ALMEIDA
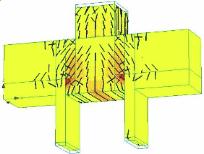
Figure 6 – Crack evolution in model 1 - (a) at the beginning of load steps;
(b) at the middle of load steps; (c) at the collapse (ATENA)
(a)
(b)
(c)
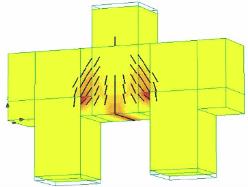
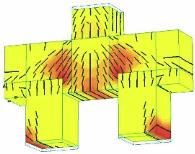
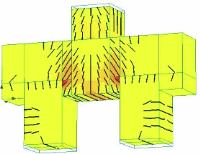
Figure 7 – Cracks at pile cap's collapse - (a) model 2; (b) model 3; (c) model 4;
(d) model 5 (ATENA)
(a)
(b)
(c)
(d)
Table 7 – Crack opening values of numerical models and Delalibera [1] experimental specimen
Load (kN)
Delalibera
[1]
110
219
438
548
780 1005 1225
Numerical
analysis
125
225
425
550
775 1000 1225
Crack
opening
(mm)
‘
Delalibera
[1]
0
0
0
0,147
0,23
0
0,26
3
(1)
0,266
Model 1
0
0,017
0,087
0,127
0,18
1
0,25
0,315
Model 2
0
0,023
0,098
0,129
0,20
9
0,26
4
0,337
Model 3
0
0,040
0,110
0,145
0,22
7
0,31
2
0,425
Model 4
0
0,017
0,086
0,126
0,16
7
0,23
0
0,293
Model 5
0
0,014
0,077
0,109
0,17
5
0,27
0
0,321
(1)
Note:
Crack opening in the experimental model [1] at point 2 was equal to 0,32mm.