Basic HTML Version


140
IBRACON Structures and Materials Journal • 2012 • vol. 5 • nº 2
Analysis of chloride diffusivity in concrete containing red mud
The specific surface area of bauxite waste is 20.27 m
2
/g, the spe-
cific gravity is 2.90 kg/dm
3
and the pH is very high (12.95), exceed-
ing the limit (12.5) for non-hazardous wastes established by the
Brazilian NBR 10004 standard.
Table 1 gives the chemical composition of the waste, while
Figure 3 shows the corresponding XRD pattern. As expected,
aluminium hydroxide (Al(OH)
3
), calcium carbonate (CaCO
3
),
and iron oxide (Fe
2
O
3
) are the predominant components, but
the relative amounts of SiO
2
, muscovite, FeO(OH) and Na
2
O
(or NaOH) are also relevant. Some of these oxides were also
detected by XRD, in addition to aluminum hydroxide and a com-
plex Na
5
Al
3
CSi
3
O
15
phase.
3.2 Ensaio de migração de cloretos
Figure 4 shows the evolution of chloride concentration in the ano-
lyte chamber during migration tests. Four samples were used for
each addition content and the results presented are the mean val-
ues obtained with their standard deviations. As expected, Cl
-
con-
centration increases with time once the voltage is applied, follow-
ing the predictable trend.
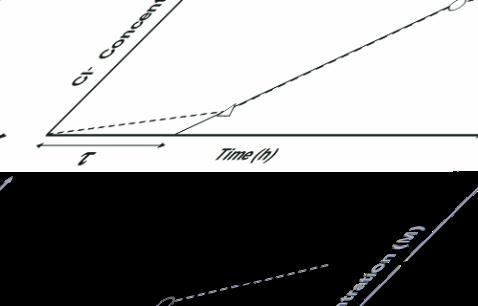
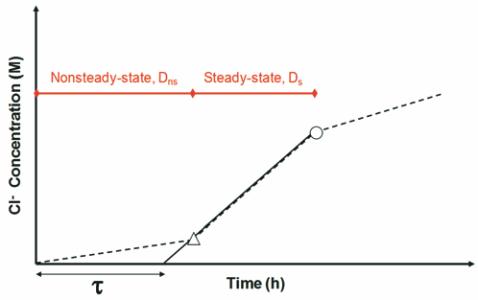
Initially, there is a period in which the amount of chlorides passing
into the anolyte chamber is negligible. Its duration corresponds to
the so-called “time lag” (t), and can be defined as the time required
for chlorides to pass through the concrete disc, causing its satura-
tion. This period of time will later serve as the basis for estimating
the D
ns
values. After this period, the flux of chloride ions through
the specimen becomes constant, which corresponds to the steady-
state period.
Table 1 – Chemical composition of red mud estimated by XRF
Component
Al O
2 3
Fe O
2 3
Na O
2
CaO
SiO
2
K O
2
MnO
TiO
2
Others
a
LOI
Content (wt.) % 19.87 19.85 7.35 4.61 14.34 1.87 0.21 2.66 1.01 27.20
a
LOI = Loss on ignition
Figure 3 – X-ray diffraction
(XRD) pattern of dry red mud
–
Figure 4 – Evolution of Cl
concentration in the anolyte
chamber of a migration test cell
over time, based on samples
of concrete containing different
amounts of red mud (0 – 30%). (
∆
= onset of
steady-state and
○
= end of nonsteady-state)
Figure 5 – Experimental determination
of the time lag (
t
); onset (
∆
) and
end (
○
) of the steady-state diffusion
stage, with a diffusion coefficient of D
s