Basic HTML Version


141
IBRACON Structures and Materials Journal • 2012 • vol. 5 • nº 2
D.V. RIBEIRO
| J.A. LABRINCHA
|
M.R. MORELLI
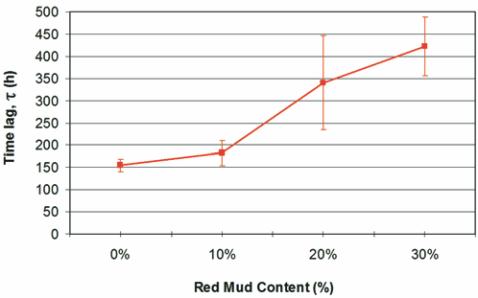
The “time lag” is empirically obtained from the intersection between
the extension of the line that characterizes the steady-state and
the time axis, according to the diagram of Figure 5.
Figure 6 shows that the “time lag” increases with increasing waste
content, probably due to the reduction of a relative number of capillary
pores
[19]. Moreover, the mud particles may close or interrupt the con-
nectivity between some of those pores, thus diminishing the capillary
suction of the concrete and hindering the transport of substances
[20].
This occurs even in samples showing higher total porosity, meaning
that within certain limits this parameter is not relevant.
After the time lag, the flux of chloride ions through the specimen in-
creases at a constant rate, which corresponds to the steady-state
regime
[16]. The steady-state diffusion coefficient (D
s
) in migration
tests is estimated using the Modified Nernst–Planck equation:
(1)
DF
=
g
Cl
Cl
S
zFC
RTl
J
D
where: D
s
= steady-state diffusion coefficient; J
Cl
= flux of chloride
ions (mol/cm
2
.s); R = gas constant (1.9872 cal/mol.K); T = tempera-
ture (K); l = sample thickness (4 cm); z = ion valence (chlorides = 1);
F = Faraday´s constant (23063 cal/volt.eq); C
cl
= chlorides concen-
tration in the catholyte (mol/cm
3
); g = activity coefficient of the catho-
lyte solution (Cl
-
= 0.657) and ΔФ = effective applied voltage (12V).
The chloride ion flux (J
Cl
) represents the speed at which the ions
are transported through the concrete, and the steady-state and
nonsteady-state diffusion coefficients are calculated based on
this flux. The chloride ion flux can be calculated using the linear
slope, between the start and the end of steady-state diffusion on
the graph representing the evolution of the chloride concentration
in the anodic cell as a function of time (see Figure 5):
dt
dC
A
V J
Cl
×
=
where, A= exposed area (cm²); V = volume of the cathodic cham-
ber (cm
3
) and; dC/dt = linear slope of steady-state diffusion, on the
graph of chloride concentration as a function of time.
The time that chlorides would require under natural conditions
of diffusion to reach the penetration depth observed in migration
tests, t
dif
, is calculated according to Equations (B) and (C), pro-
posed by CASTELLOTE et al. [16].
(2)
úû
ù
êë
é
-
×
×
=
2
2
coth
6 1
2
n
n
tn
dif
t
(3)
kT
ze
DF
=n
where: t = time-lag in the migration test; t
dif
= time equivalent of
diffusion (s); e = electron charge (1.6 10
-19
C); k = Boltzmann’s
constant (1.38 10
-23
J/K).
This mathematical solution allows migration tests to be “converted”
into natural tests. In other words, using this “equivalent” time (t
dif
),
D
ns
is obtained directly from Equation (D):
(4)
dif
ns
t
l
D
3
2
=
where: l = specimen thickness (cm).
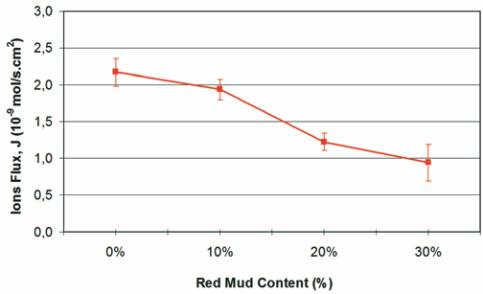
Figure 7 shows the flow of chloride ions, J
Cl
, through the con-
crete as a function of red mud content in the material. This pa-
rameter represents the speed at which the ions are transported
through the concrete and from which the steady-state and non-
Figure 6 – Time lag estimated
from chloride migration tests
as a function of red mud content
in concrete cured for 28 days
Figure 7 – Chloride ion flow (J )
Cl
as a function of red mud
content in concrete cured for 28 days,
estimated from migration tests