Basic HTML Version


7
IBRACON Structures and Materials Journal • 2012 • vol. 5 • nº 1
A. D. de Figueiredo | A. de la Fuente | A. Aguado | C. Molins | P. J. Chama Neto
of the pipe. The difference observed in the pattern of the curves
obtained in the two series of test is only attributed to geometric
factors, and the characteristics of matrix and type of reinforcement
have no influence on the results. So, the displacement measured
at the socket will always be smaller than the one measured at the
spigot. In that sense, the enlargement of the socket is the main
factor influencing the pattern of the curves at the elastic region.
Due to the fact that the spigot will present a higher level of dis-
placement, this region will present the higher level of strain and,
consequently, will reach the elastic limit sooner. So, is possible to
conclude that the cracking of the pipes always begins at the spigot,
because the concrete reaches its elastic strain limit in this region
before it occurs in the socket. In the particular case of this study it
occurs around 80 kN of loading, when the stiffness of the compo-
nent was greatly reduced. As the displacements measured in the
2
nd
Series were much superior to the 1
st
Series due to the previ-
ously discussed loss of stiffness, it is also possible to conclude for
the equivalence of the two behaviors, because both series reached
close levels to residual strength. It should be emphasized that this
pattern of behavior is totally consistent with the model proposed
by de la Fuente
et al.
[5] for numerical modeling of pipes behavior
during the crushing test.
An important aspect to have attention is the fact that it is impos-
sible to carry out the standard cyclic test with pipes reinforced with
40 kg/m
3
of steel fibers. The difficulty occurs because of the hard-
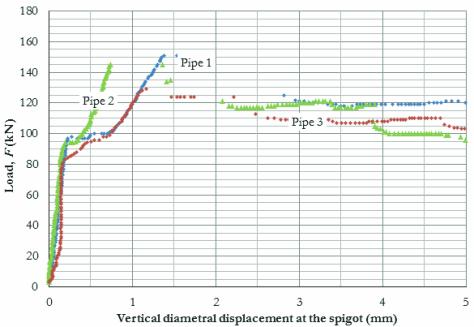
Figure 12 – Load versus displacement curves
obtained during crushing test of pipes with a
3
fiber consumption of 20 kg/m and with the
diametrical displacement measured
only at the spigot
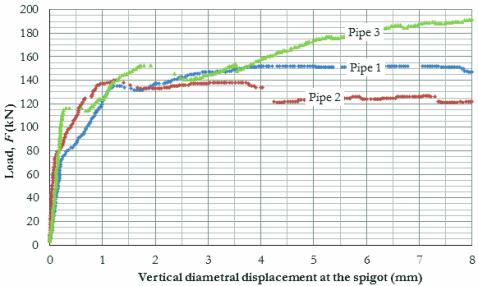
Figure 13 – Load versus displacement curves
obtained during crushing test of pipes with
3
a fiber consumption of 40 kg/m and with the
diametrical displacement measured
only at the spigot
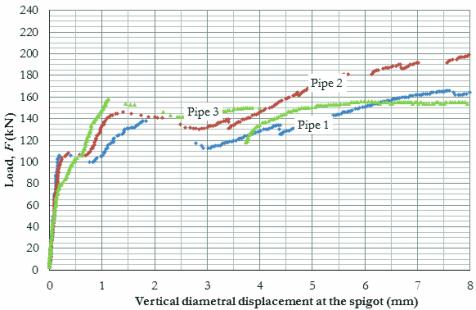
Figure 14 – Load versus displacement curves
obtained during crushing test of pipes with
conventional reinforcement and with the
diametrical displacement measured
only at the spigot
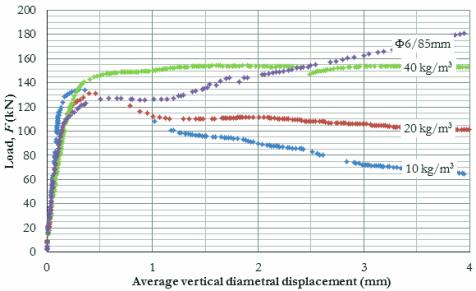
Figure 15 – Average load versus diametrical
displacement curves of pipes tested
st
in the 1 Series