Basic HTML Version


8
IBRACON Structures and Materials Journal • 2012 • vol. 5 • nº 1
Steel fiber reinforced concrete pipes. Part 1: technological analysis of the mechanical behavior
ening behavior of these pipes. In this particular case, the drop in
post-peak strength at low displacements could not possible be ob-
served. Thus there will be a high level of displacement and crack-
ing when the unloading was done during the regular cyclical test.
So, the standard procedure had the implicit concept that the FRCP
should always show a softening behavior to turn possible to per-
form the cyclical test. Thus, the continuous measurement system
using LVDTs provides greater reliability to the test in these situa-
tions. Especially when the serviceability conditions associated to
the level of crack opening is considered.
There were also regions of post-peak instability in the crushing test
response, similar to those observed by Figueiredo [7] when low
amounts of fiber were used. This instability is provoked by the pro-
cess of slipping and loss of adhesion of the fibers, in addition to
possible rupture of some of them, occurring during the stress trans-
fer from the matrix to the fibers. Furthermore, the increase in fiber
content enhanced the cracking load of the matrix, corresponding to
the end of the initial linear part of the curve. This, however, became
clear only for the 1
st
Series of pipes. In this series there was an in-
crease of the material cohesion due to the fiber addition in to the ma-
trix. So, there was the correction of water content in the concrete for
the 2
nd
Series in order to maintain the level of mobility of the matrix.
In that situation, the increase in water/cement ratio gives a reduction
of the matrix strength, which reduced the contribution of fiber to the
elastic behavior of the component. Although this, a reduction in the
load at the end of the elastic part of the curves was not observed. It
occurs due to the increase in the fiber content that had improved the
tensile strength capacity of concrete pipe.
It was observed that the pipes also met the requirements of the
standards [2 and 4] for Class AE2. In the case of pipes with 600
mm nominal diameter the Brazilian [2] and European [4] standards
require that the pipes have to present a load control of 36 kN/m
and an ultimate load of 54 kN/m. As the pipe length was 2.5 m, it
accomplish that a total load control is 90 kN per pipe, and a ulti-
mate load is 135 kN per pipe.
Checking the average results presented in Figures [15] and [16], it is
possible to figure out that all SBRCP exceeded both the control and
ultimate load by a wide margin, especially in the 1
st
Series. In this
particular case, the limit of the elastic behavior reached about 130
kN (less than the proof load where the pipe may have a certain level
of cracking). The average ultimate load was 230 kN, obtained direct-
ly from the test machine record system because it occurs when the
displacement was larger than the measurement limit of the LVDTs.
With these results, these pipes were about to fit the requirement of
the superior class (EA3 for the Brazilian standard), which requires
control and ultimate loads of 135 kN and 202.5 kN, respectively. In
the 2
nd
Series, the results were slightly lower than the first one for
the ultimate strength, which reached the averaged load of 174.7 kN.
Since the end of the initial elastic segment was close to 90 kN, it is
possible to affirm that the pipes reached the standards requirement
narrowly. Anyway, it is possible to consider them as appropriate to
the requirements of the standards for class EA2.
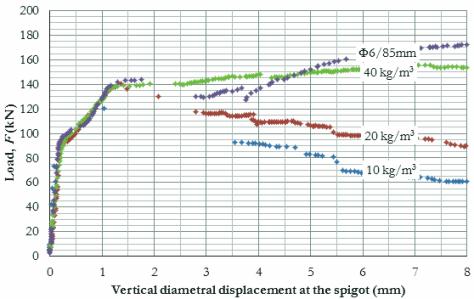
Observing the curves presented in Figures [15] and [16], it is
possible to affirm that there is proximity between the behavior of
SBRCP and FRCP in the first half of the load versus displace-
ment curves. This behavior occurs in more intense way until a
vertical displacement of about 0.4 mm and 2 mm for the first and
2
nd
Series respectively. The FRCP with 40 kg/m
3
exceeded the
strength loads of SBRCP until displacements of about 2.5 mm and
4.5 mm for the first and 2
nd
Series respectively. It is possible to
affirm that the FRCP presented a similar behavior to a superior
class of SBRCP in those circumstances. The initial region of the
curves could be associated to the serviceability limit state or, in
other words, corresponding to the elastic or low level of cracking
behavior. So, the fiber contribution will be more effective for the
pipes service life than the contribution presented by the steel bars.
Note that all the pipes of the 1
st
Series showed the initial elastic
part of the curve slightly exceeding 100 kN. With respect to this
aspect, it was observed that cracking began, in all cases, at the
top of the section A with values of
F
cr
around 90 kN. On the other
hand, in the pipes from the 2
nd
Series, it was observed that the ap-
pearance of the first cracks coincided with the change in the slope
of the load-displacement curve. This change was not detected in
the pipes from the 1
st
Series until the springline had also cracked,
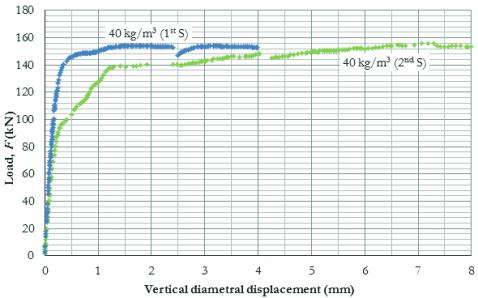
Figure 16 – Average load versus diametrical
displacement curves of pipes tested
nd
in the 2 Series
Figure 17 – Comparison between the average
curves measured at the socket and
st
spigot (1 Series) and only at the spigot
nd
3
(2 Series) for FRCP with 40 kg/m steel fibers