Basic HTML Version


6
IBRACON Structures and Materials Journal • 2012 • vol. 5 • nº 1
Steel fiber reinforced concrete pipes. Part 1: technological analysis of the mechanical behavior
hardening pattern, which consists of increasing resisted load with
increasing vertical displacement of the pipe. Thus, the resistance
displayed by pipes with regular reinforcement was largest than the
presented by FRCP at higher displacements. However, for lower
strain, the residual strength capacity was greater for FRCP. This
occurs because the bars are positioned at the innermost part of
the pipe wall and they are mobilized more intensely when there
is greater displacement and hence higher level of cracking. On
the other hand, the fibers are distributed throughout the thickness
of the pipe wall. Thus, the fibers reinforcement is mobilized with
small levels of displacement and cracking, which provides better
performance in this situation.
In order to facilitate the analysis of the influence of the setups for
measuring displacements in the pipes during the crushing test
the results of the average curves obtained with the greater fiber
content are presented in Figure [17]. The results obtained in the
1
st
Series, where the displacement measurements were made at
the spigot and at the socket simultaneously, had presented higher
stiffness in the beginning of the curve. The end of the initial elastic
line was prolonged by the influence of the socket region where the
concrete matrix contributes more intensely [14]. For the 2
nd
Series,
where the displacements were measured only at the spigot, they
were more intense for smaller loads, due to lower rigidity of this part
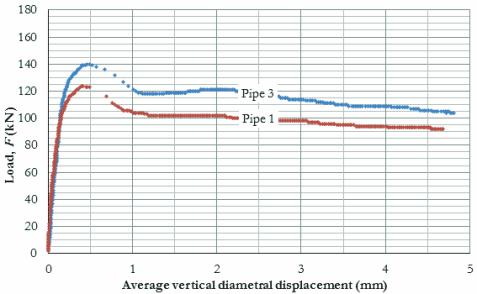
Figure 8 – Load versus displacement curves
obtained during crushing test of pipes with a
3
fiber consumption of 20 kg/m and with the
diametrical displacement measured
at the spigot and the socket
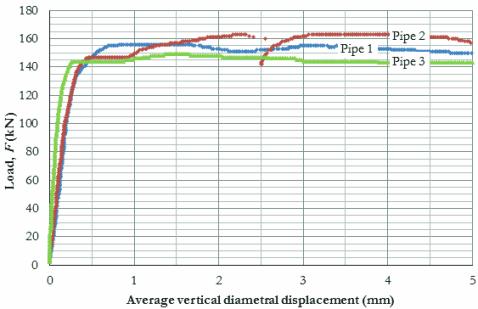
Figure 9 – Load versus displacement curves
obtained during crushing test of pipes with a
3
fiber consumption of 40 kg/m and with the
diametrical displacement measured
at the spigot and the socket
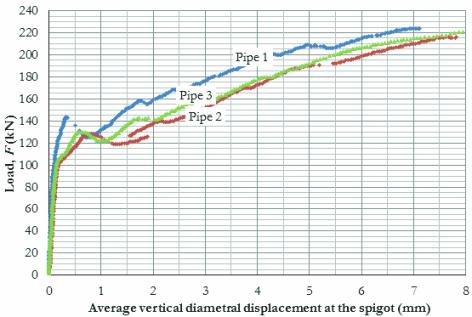
Figure 10 – Load versus displacement curves
obtained during crushing test of pipes with a
conventional reinforcement and with the
diametrical displacement measured
at the spigot and the socket
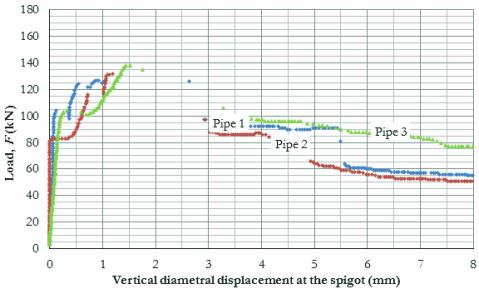
Figure 11 – Load versus displacement curves
obtained during crushing test of pipes with a
3
fiber consumption of 10 kg/m and with the
diametrical displacement measured
only at the spigot