Basic HTML Version


5
IBRACON Structures and Materials Journal • 2012 • vol. 5 • nº 1
A. D. de Figueiredo | A. de la Fuente | A. Aguado | C. Molins | P. J. Chama Neto
due to failures in the test system, where the reading of the strain
was impaired. Because of that, only two curves are shown in Fig-
ures [7] and [8].
The fact that pipes have been tested in real scale caused a re-
duction of the results variability. In ordinary tests to determine the
toughness of fiber reinforced concretes, the coefficient of variation
can exceed 20% [12]. This occurs because the crack area (where
the fibers act as a stress transfer bridge) is much larger in a tube
than in a prismatic specimen. This reduction in variability has been
observed in previous studies [7 and 13].
The first perceptible aspect was the behavior with a well defined
pattern for pipes reinforced with smaller amounts of fiber. This
softening pattern was characterized by a reduction of the strength
of the pipe with increasing vertical displacement. The pipes re-
inforced with steel bars or 40 kg/m
3
of fibers had presented a
Table 2 – Differences between the two series of pipes used in the experimental study
Series
LVDT position
Cement
Water content
First
At the spigot and socket
Brand 1
3
Fixed on 141 liters/m
Second
Only at the spigot
Brand 2
Adjusted for each mix (constant consistency)
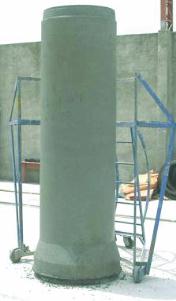
Figure 5 – General appearance of a
new fiber reinforced concrete pipe
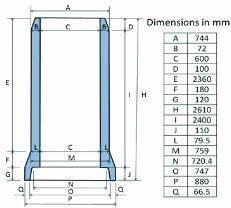
Figure 6 – Geometric characterization
of the pipe used in the experiment
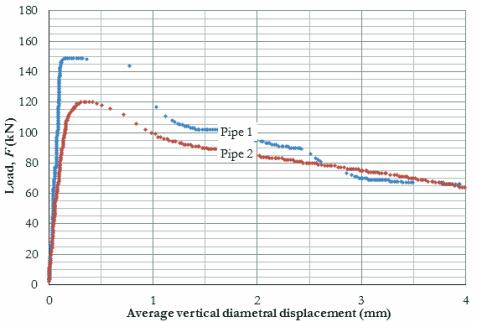
Figure 7 – Load versus displacement curves
obtained during crushing test of pipes with a
3
fiber consumption of 10 kg/m and with the
diametrical displacement measured
at the spigot and the socket