Basic HTML Version


4
IBRACON Structures and Materials Journal • 2012 • vol. 5 • nº 1
Steel fiber reinforced concrete pipes. Part 1: technological analysis of the mechanical behavior
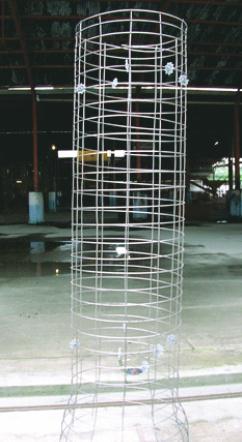
The main steel reinforcement (transverse reinforcement) was made
with cold drawn steel bars (yield strength of 600 MPa) with a di-
ameter of 6 mm, and spaced each 85mm. The main reinforcement
was positioned at the center of the pipe wall with equal distance for
both inner and outer surface. A support reinforcement (longitudinal)
made with 6 wires of the same type of steel was also used. The main
reinforcement was positioned at the center of the pipe wall. The con-
sumption of steel for this family of pipes was approximately 40 kg/
m
3
. It was observed that the pipes produced with fibers presented a
very good final finishing of the surface (Figure [5]), which reinforces
the idea of the feasibility of its implementation.
After the production, the pipes remained in the storage yard of the
factory until the moment of the crushing tests. All pipes were tested
over the age of 28 days and at the same time. Other studies [11]
found that there was no significant change in the behavior of re-
inforced concrete pipe in the hardened state when tested at ages
ranging from 10 to 96 days. So, it was assured that there was no
influence of age of the pipes in the results. The pipes were pro-
duced using the vibro-compression method with high speed (5000
rpm) to compact the concrete. The geometric characteristics of the
pipes are presented in Figure [6]. A summary of the differences
between the two series is shown in Table [2].
3. Results and Analysis
The characteristic compressive strength of the concrete was 50
MPa, obtained directly from the regular quality control results
obtained by the factory. For each pipe, it was recorded the load
versus displacement curve during the crushing test. The results
obtained with the 1
st
Series, where the average displacement was
measured at the spigot and the socket simultaneously, are pre-
sented in Figures [7] to [10]. The results obtained with the mea-
surement made only at the spigot, corresponding to the 2
nd
Series,
are presented in Figures [11] to [14]. In order to facilitate the com-
parison between the results, they are also presented in Figures
[15] and [16] in terms of average curves obtained for the first and
2
nd
Series, respectively. Only two results of the 1
st
Series were lost
Figure 4. Rebars set up used in SBRCP production that served as
a parameter for comparative performance evaluation with FRCP.
Some problems were observed molding the 1
st
Series of pipes due to
increased cohesion provided by the steel fibers. These problems were
corrected in the 2
nd
Series by adjusting the moisture of the mixture to
maintain the fixed level of cohesion of the material. There was also
changing the cement brand from first to 2
nd
Series due to problems with
suppliers. The materials used in this study and its consumption per cubic
meter of concrete are presented in Table [1]. The steel fiber type used
in the experiment was a glued hooked end drawn wire, 60 mm in length
and diameter of 0.75 mm. So, the aspect ratio of the fiber was 80.
Figure 4 – Rebars set up used in SBRCP
production that served as a parameter for
comparative performance evaluation with FRCP
Table 1 – Material and its consumption
per cubic meter of concrete used
in the production of pipes used in
this experimental study
Material
Consumption
3
(kg/m )
Fine aggregate I (Natural river sand)
629
Fine aggregate II (crushed sand)
315
Coarse aggregate (crushed stone)
988
Cement (CP III 40 RS)*
329
Water**
141
* A different brand of cement was used for each series of pipes.
nd
** This amount of water was changed in the 2 Series
through visual analysis of the mixture in order to maintain
fixed the concrete consistency.