Basic HTML Version


256
IBRACON Structures and Materials Journal • 2012 • vol. 5 • nº 2
Three-dimensional analysis of two-pile caps
(3)
,inf
min ,
ctk
y f
ct
f h h
R
× ×
=
(4)
2
2
)
4 2
(
d a L
h
x
est
f
+ +
=
Where:
R
ct, min
: minimum tensile force;
h
f
: vertical dimension – strut and tie model (Delalibera [1]);
h
y
: column cross-section;
f
ctk, inf
: inferior value of concrete characteristic tensile resistance;
L
est
: piles span;
A
x
: pile dimension in the considered direction.
2.4 Analysis method
The Newton-Rhapson analysis method was adopted with a con-
centrated load at the center of the column’s superior cross-section
and force increments of 25 kN. Added to this, an hexahedral finite
elements mesh was adopted to pile caps, piles and columns as
shown in Figure 5. And a tetrahedral finite elements mesh was
adopted for the steel plates.
Absolute (100%) and partial (50% and 25%) vertical movement
restraints were imposed to piles base supports. At piles-pile cap
and column-pile cap contact surfaces a finite elements 3D inter-
face was used based on Mohr-Coulomb criterion. Their properties
are presented in Table 6.
3. Considerations on numerical
and experimental models
3.1 Divergences between numerical
and experimental models
One of the most discrepant structural behaviors observed between
numerical and experimental models was in the stiffness pile caps,
which was much higher in numerical models. This fact demon-
strates the inherent complexity of laboratory experiments.
Delalibera [1] points out three main reasons for this stiffness differ-
ence, which are prototype accommodation at the beginning of the
experiment, perfect bond assumption between steel bars and con-
crete in numerical models and perfect connection between piles
and pile cap.
In reference to the first reason, [1] cites pile cap accommodation at
the beginning of the experiment, which was verified in load versus
displacement curve. About the second reason, the author did not
confirm this hypothesis after the preliminary tests. And in respect
to the third reason, [1] affirms that this is probably what has mainly
collaborated to the augment in pile cap’s stiffness, since a detach-
ment between piles-pile cap interface occurred. Therefore, [1] sug-
gests the use of interface finite elements on the contact surfaces of
the structural elements.
Following the recommendation of [1], all numerical pile caps were
modeled using a finite elements interface between column-pile cap
contact and piles-pile cap contacts. Moreover, the supporting area
of the piles was reduced in order to observe pile caps stiffness
behavior.
The reduction of the supporting area of the piles enabled an in-
crease in pile caps strains and displacements. This fact is in accor-
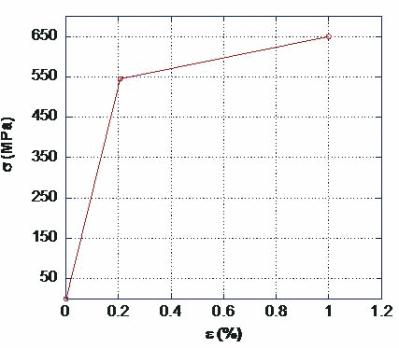
Table 4 – Reinforcement properties
Poisson’s ratio (
n
)
0,3
Modulus of Elasticity (E )
s
210 GPa
Yield Strength (f )
yk
545 MPa
Ultimate Tensile Strength (f )
tk
650 MPa
Yield Strain (
e
)
yd
0,207%
Ultimate Strain (
e
)
lim
1%
Table 5 – Steel plates properties
Poisson’s ratio (
n
)
0,3
Modulus of Elasticity (E )
s
210 GPa