Basic HTML Version


88
IBRACON Structures and Materials Journal • 2012 • vol. 5 • nº 1
Reliability of buildings in service limit state for maximum horizontal displacements
and beams are multiplied by 0,70. In the second model, equivalent
stiffness are obtained by multiplying the stiffness of columns and
beams by 0,80 and 0,40, respectively. In this article, these models
are referred to as 70/70 and 80/40, respectively.
The secant Young´s modulus of concrete is:
(7)
sec
0.85 5600
E
fck
= ×
where:
E
sec
: secant Young´s modulus;
f
ck
: characteristic concrete resistance at 28 days.
3. Model errors
The simplified stiffness reducing models proposed in ABNT
NBR6118:2003 [1] are, naturally, approximations of reality. A
variable that measures the accuracy or precision of these, called
model error, is obtained by dividing the displacements obtained
via a rigorous material non-linear analysis by the displacements
obtained using the simplified model (OLIVEIRA et al. [9]):
(8)
rigorous
simplifyed
M
u
E
u
=
This is a random variable as, for different structures, the simplified
model can be more or less precise. One sample (set of observa-
tions) of the model error random variable is obtained by evaluating
equation (8) for a set of different structural configurations. In this arti-
cle, a sample of the two model error random variables is obtained by
evaluating 42 representative plane frames of different geometries,
materials and reinforcement ratios. Frames of four, eight and twelve
floors are considered, with one to three bays. The studied frames
are variations from the frames represented in Figure 3. Concrete
resistances varied from 20 to 40 MPa. Three reinforcement ratios
were considered: low, medium and high. The low reinforcement ratio
is close to the lower limit, medium is around 2% and high is close to
the upper limit (3 to 4%) allowed in ABNT NBR6118:2003 [1]. Verti-
cal loading was determined based on the process of influence areas
(slabs, beams, columns, walls and coverings). Accidental load was
adopted as 1,5 kN/m² in the influence area. Details of the studied
frames are presented in Table 1. The table also presents the model
error observations obtained for these frames.
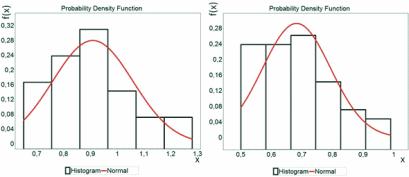
Figure 4 shows the histograms that were obtained from the model
error samples, as well as the probability distribution functions that
were adjusted to the data. For the simplified model with 70/70 stiff-
ness reduction, a Normal distribution was obtained with parameters:
(9)
E
M
70/70
~N(μ=0.908, σ=0.150)
For the simplified model with 80/40 column/beam stiffness reduc-
tion, a Normal distribution was obtained with parameters:
(10)
E
M
80/40
~N(μ=0.682, σ=0.111)
The coefficient of variation (c.o.v) is similar for both models error
variables (σ/μ=0.16).
The Normal distribution resulted in a good fit for both variables, as
indicated by the statistics shown in
Table 2
. For both cases, the
Normal distribution passed the Kolmogorov-Smirnov, Anderson
Darling and Chi-square goodness-of-fit tests.
Figure 4 – Histograms and probability distribution functions of model error variables:
70/70 stiffness reduction (left), 80/40 column/beam stiffness reduction (right)