Basic HTML Version


72
IBRACON Structures and Materials Journal • 2012 • vol. 5 • nº 1
The influence of low temperature on the evolution of concrete strength
4. Presentation and Result Analysis
After the rupture of the specimens in the mechanical tests, it was
compared the results to reach conclusions regarding the subject.
4.1 Trial of compression of the cylindrical specimens
The results of the resistance to compression were divided into two
stages, because it presents different behaviors. The first stage
ranged from 1 to 7 days, while the second stage was conducted
from 8 to 91 days.
The Table 5 shows the evolution of the resistance compression in
the first 7 days, when the samples were conditioned to a controlled
cure at low temperatures, ranging from 0° to 25 °C at 5 °C.
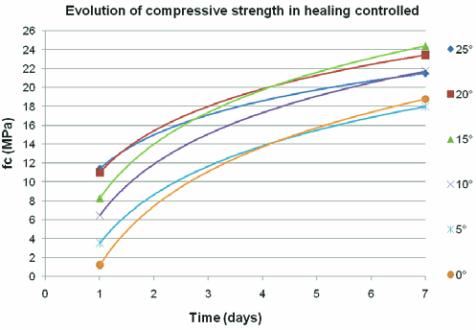
For better viewing, it was presented the results in Figure 1, relat-
ing the resistance compression in MPa, in the ‘y’ axis at the age of
rupture of the samples of the trial in ‘x’ axis, in days.
In this first period of curing it can be observed a greater variation of
resistance in the first day of measurement, which was 11.4 MPa for a
temperature of 25 °C and at 1.2 MPa for a temperature of 0 °C. The
higher curing temperatures presented superior outcomes of resistance
to compression and the resistance was gradually decreased to the low-
est temperature with the worst performance, as might be expected.
On the seventh day this variation was 24.4 MPa for a tempera-
ture of 15 °C and at 18 MPa for a temperature of 5 °C. The dif-
ference between the highest and lowest value decreased 37.25%
compared to the first period. That is, in the 7 days of curing, the
influence of initial curing temperatures have been lower, reach-
ing even to overlap different curves. Although the resistance gain
was more significant for cured concretes at lower temperatures,
approaching the cured concrete resistance at 0 °C increased about
1,600% between the 1st and 7th day, compared to a gain of 88%
of the cured at 25 °C.
Table 6 shows the evolution of resistance from 14 to 91 days of
curing. It is also illustrated in Figure 2, the results in chart form, for
better viewing.
In the second period of cure it is observed the approximation of
the results from day 7, the inversion in resistance values occurring
Table 4 – Weather conditions and
temperature of the molding
Moldings
Time and temperature of cure
0 a 7 days 8 a 91 days
1ª
25° C
20° C
2ª
20° C
20° C
3ª
15° C
20° C
4ª
10° C
20° C
5ª
5° C
20° C
6ª
0° C
20° C
Table 5 – Evolution of compressive
strength in healing controlled
Compressive strength
°C
1 day
7 days
(MPa)
(MPa)
25
11,4
21,5
20
11
23,4
15
8,3
24,4
10
6,5
21,7
5
3,5
18
0
1,2
18,8
Table 6 – Evolution of resistance to
compression in air-conditioned room (20º C)
Compressive strength
°C
14 days
28 days
91 days
(MPa)
(MPa)
(MPa)
25
24,3
26,9
29,2
20
27,5
31
31,4
15
28,7
21,7
27,8
10
27,3
31,8
28,7
5
20,9
35,6
37,6
0
30,3
38,6
38,8
Figure 1 – Evolution of compressive strength
in the first 7 days in controlled healing